Depedencies#
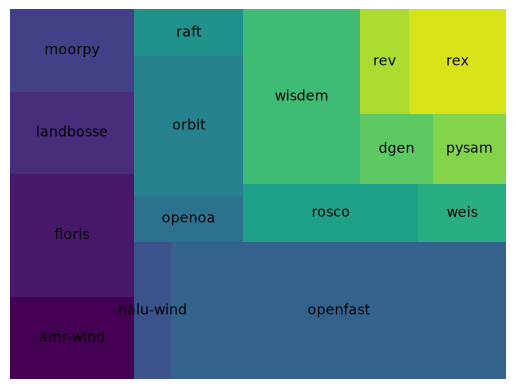
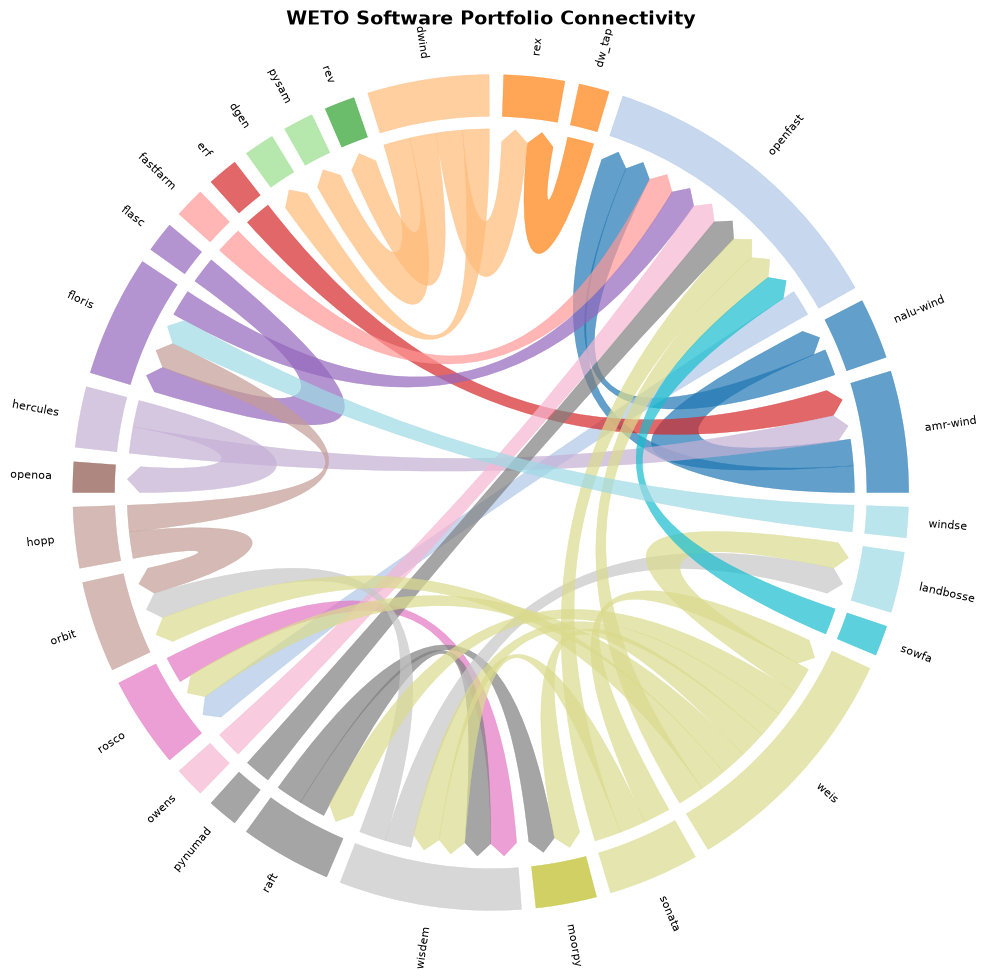
By collecting data on the projects within the WETO portfolio that use other tools within the portfolio, we can get a sense for the software projects that are at the “core” of the capabilities.
This network is divided into two types of connectivity:
Direct connections are software that are connected within the code, so they may communicate directly through API’s, share memory, and be distributed as a bundle.
Indirect connections are software that require the outputs of other tools in order to construct their inputs. These are connected through workflows rather than code.
Show code cell content
Hide code cell content
from pathlib import Path
import yaml
import networkx as nx

software_attr_dir = Path("..", "..", "software_attributes")
software_database_dir = software_attr_dir / "database"

model_list_inputs = yaml.safe_load( open(software_attr_dir / "database_list.yaml", "r") )
models = model_list_inputs["active"] + model_list_inputs["partial"]

model_attributes_map = {
    model: yaml.safe_load( open( software_database_dir / f"{model}.yaml", "r") )
    for model in models
}
Show code cell content
Hide code cell content
model_connectivity = {}
for model in models:
    model_attributes = model_attributes_map[model]
    if "dependencies" not in model_attributes:
        continue
    model_connectivity[model] = model_attributes["dependencies"]

network_graph = nx.DiGraph()
for model, connections in model_connectivity.items():
    for c in connections:
        weight = 1 if c[1] == "direct" else 2
        network_graph.add_edge(model, c[0], weight=weight)
Show code cell source
Hide code cell source
import html as html_lib
import json
import warnings
from pyvis.network import Network
from IPython.display import HTML

net = Network(
    height="750px",
    width="100%",
    directed=True,
    cdn_resources="remote",
    bgcolor="#ffffff",
    font_color="#333333",
)

# Nodes sized by how many other tools depend on them
for node in network_graph.nodes:
    in_degree = network_graph.in_degree(node)
    net.add_node(
        node,
        label=node,
        size=10 + 4 * in_degree,
        title=f"{node} — depended on by {in_degree} tool(s)",
    )

# Edges colored/styled by connection type
for source, target, attrs in network_graph.edges(data=True):
    is_direct = attrs["weight"] == 1
    net.add_edge(
        source,
        target,
        color="#1f77b4" if is_direct else "#ff7f0e",
        dashes=not is_direct,
        title="direct" if is_direct else "indirect",
    )

# A large fixed label font with a white halo keeps text legible without zooming,
# while a compact physics layout keeps the fitted view close enough to read.
net.set_options(json.dumps({
    "nodes": {
        "font": {
            "size": 32,
            "face": "arial",
            "color": "#222222",
            "strokeWidth": 4,
            "strokeColor": "#ffffff",
        },
    },
    "edges": {
        "color": {"inherit": True},
        "width": 3,
        "smooth": {"type": "dynamic"},
    },
    "physics": {
        "barnesHut": {
            # Disconnected components only attract via centralGravity; raise it
            # (and soften the repulsion) to pull separate clusters closer.
            "gravitationalConstant": -18000,
            "centralGravity": 1.5,
            "springLength": 95,
            "springConstant": 0.04,
            "damping": 0.09,
            "avoidOverlap": 0.2,
        },
        "minVelocity": 0.75,
        "stabilization": {"iterations": 250},
    },
    "interaction": {
        "hover": True,
        "dragNodes": True,
        "navigationButtons": True,
    },
}))

# Embed the generated page in an iframe so it renders inline and in the built docs
net_html = net.generate_html(notebook=False)
with warnings.catch_warnings():
    # HTML() warns when its content contains an <iframe>; that is exactly what
    # we want here, so the suggestion to use IFrame does not apply.
    warnings.simplefilter("ignore", UserWarning)
    display(
        HTML(
            f'<iframe srcdoc="{html_lib.escape(net_html)}" '
            'width="100%" height="770" frameborder="0"></iframe>'
        )
    )
Show code cell source
Hide code cell source
import numpy as np
import matplotlib.pyplot as plt
from mpl_chord_diagram import chord_diagram
import networkx as nx

# Restrict to tools that participate in at least one dependency relationship
connected_nodes = [n for n in network_graph.nodes if network_graph.degree(n) > 0]

# Directed adjacency matrix: entry [i, j] encodes a dependency of i on j.
# Use unweighted edges (1 per connection) so ribbon width reflects the number
# of dependencies rather than the direct/indirect weight.
adjacency = nx.to_numpy_array(network_graph, nodelist=connected_nodes, weight=None)

fig, ax = plt.subplots(figsize=(10, 10))
# "Sink" tools (depended upon but depending on nothing) have a zero row sum,
# which triggers a benign divide-by-zero warning inside mpl_chord_diagram.
with np.errstate(invalid="ignore", divide="ignore"):
    chord_diagram(
        adjacency,
        names=connected_nodes,
        directed=True,
        rotate_names=True,
        fontsize=8,
        cmap="tab20",
        ax=ax,
    )
ax.set_title("WETO Software Portfolio Connectivity", fontsize=14, fontweight="bold")
plt.show()
Show code cell source
Hide code cell source
import squarify
import matplotlib.pyplot as plt

# Count the number of projects depending on each project
depending = {model: 0 for model in models}
for model, dependents in model_connectivity.items():
    for d in dependents:
        depending[d[0]] = depending[d[0]] + 1

non_zero = {k:v for k,v in depending.items() if v > 0}

cmap = plt.get_cmap("viridis")
colors = [cmap(i / len(non_zero)) for i in range(len(non_zero))]

squarify.plot(list(non_zero.values()), label=list(non_zero.keys()), color=colors)
plt.axis("off")
(np.float64(0.0), np.float64(100.0), np.float64(0.0), np.float64(100.0))