"""Example: Reference turbines

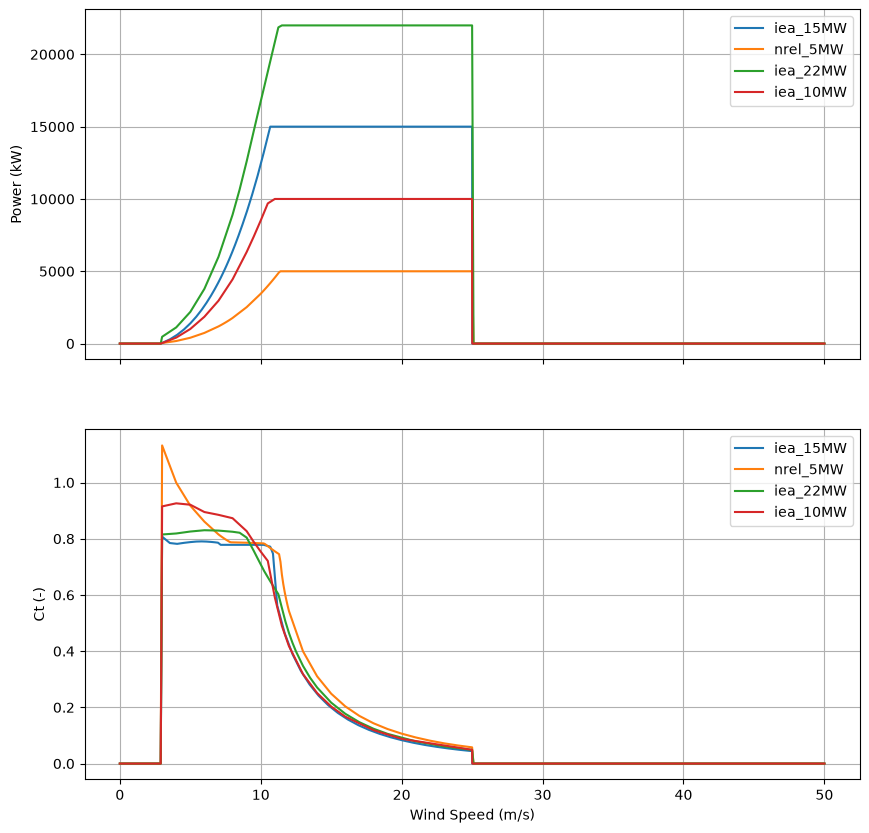
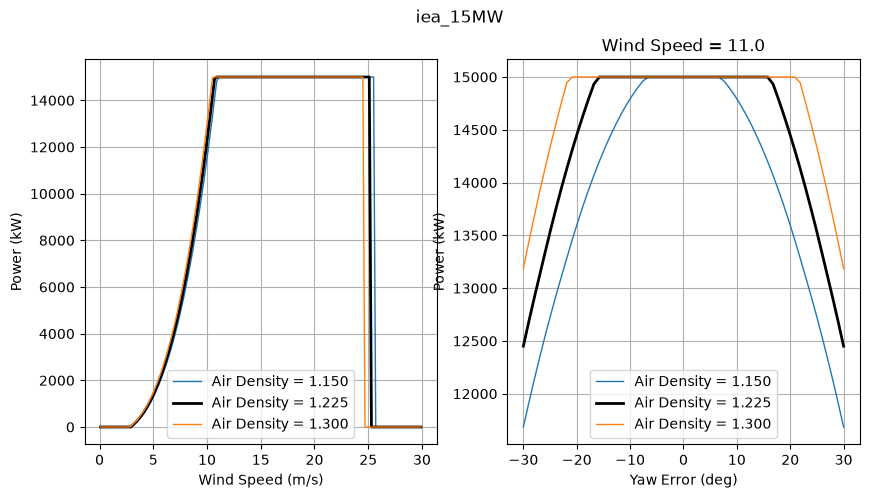
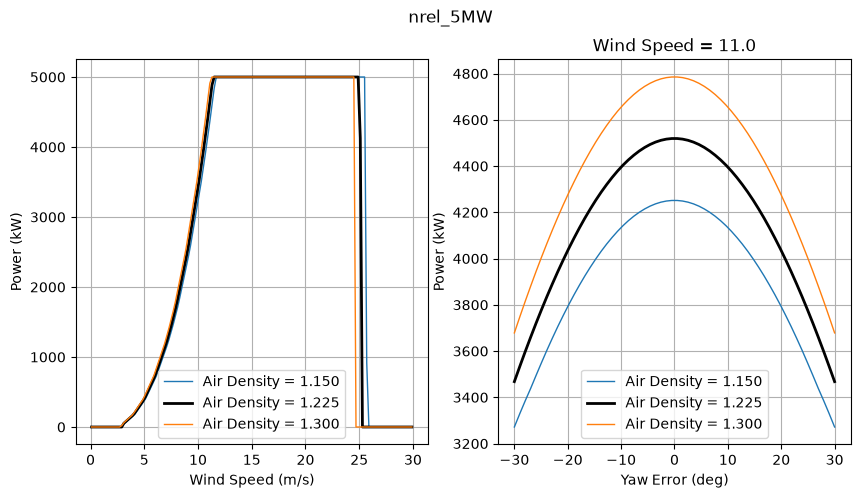
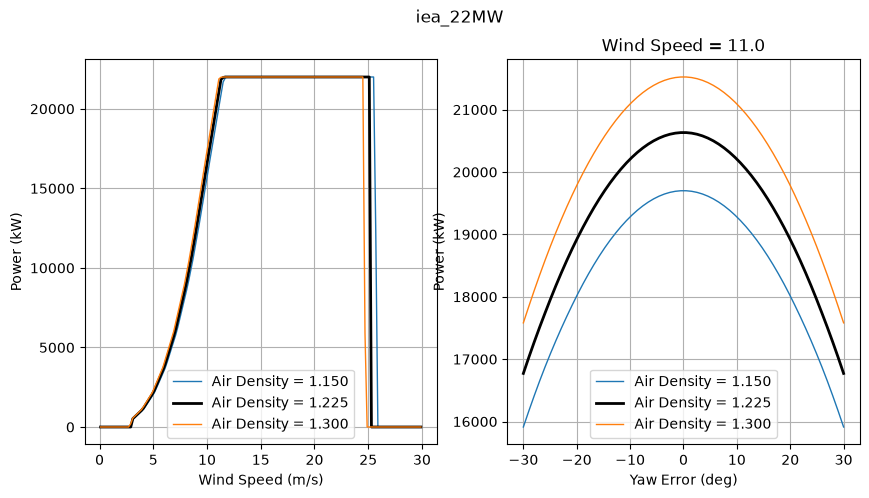
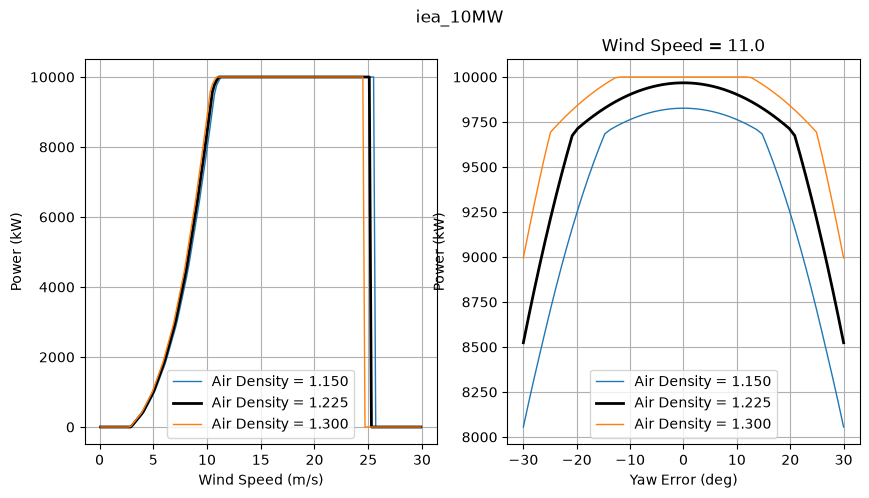
For each reference wind turbine in the turbine library, make a small figure
showing its power and thrust coefficient curves and demonstrate its power loss
to yaw.
"""


import matplotlib.pyplot as plt
import numpy as np

from floris import FlorisModel


ws_array = np.arange(0.1, 30, 0.2)
wd_array = 270.0 * np.ones_like(ws_array)
turbulence_intensities = 0.06 * np.ones_like(ws_array)
yaw_angles = np.linspace(-30, 30, 60)
wind_speed_to_test_yaw = 11

# Grab the gch model
fmodel = FlorisModel("../inputs/gch.yaml")

# Make one turbine simulation
fmodel.set(layout_x=[0], layout_y=[0])

# Apply wind directions and wind speeds
fmodel.set(
    wind_speeds=ws_array, wind_directions=wd_array, turbulence_intensities=turbulence_intensities
)

# Get a list of available turbine models provided through FLORIS, and remove
# multi-dimensional power/thrust coefficient turbine definitions as they require different handling
turbines = [
    t.stem
    for t in fmodel.core.farm.internal_turbine_library.iterdir()
    if t.suffix == ".yaml" and ("multi_dim" not in t.stem)
]

# Declare a set of figures for comparing cp and ct across models
fig_pow_ct, axarr_pow_ct = plt.subplots(2, 1, sharex=True, figsize=(10, 10))

# For each turbine model available plot the basic info
for t in turbines:
    # Set t as the turbine
    fmodel.set(turbine_type=[t])
    fmodel.reset_operation() # Remove any previously applied yaw angles

    # Since we are changing the turbine type, make a matching change to the reference wind height
    fmodel.assign_hub_height_to_ref_height()

    # Plot power and ct onto the fig_pow_ct plot
    axarr_pow_ct[0].plot(
        fmodel.core.farm.turbine_map[0].power_thrust_table["wind_speed"],
        fmodel.core.farm.turbine_map[0].power_thrust_table["power"],
        label=t,
    )
    axarr_pow_ct[0].grid(True)
    axarr_pow_ct[0].legend()
    axarr_pow_ct[0].set_ylabel("Power (kW)")
    axarr_pow_ct[1].plot(
        fmodel.core.farm.turbine_map[0].power_thrust_table["wind_speed"],
        fmodel.core.farm.turbine_map[0].power_thrust_table["thrust_coefficient"],
        label=t,
    )
    axarr_pow_ct[1].grid(True)
    axarr_pow_ct[1].legend()
    axarr_pow_ct[1].set_ylabel("Ct (-)")
    axarr_pow_ct[1].set_xlabel("Wind Speed (m/s)")

    # Create a figure
    fig, axarr = plt.subplots(1, 2, figsize=(10, 5))

    # Try a few density
    for density in [1.15, 1.225, 1.3]:
        fmodel.set(air_density=density)

        # POWER CURVE
        ax = axarr[0]
        fmodel.set(
            wind_speeds=ws_array,
            wind_directions=wd_array,
            turbulence_intensities=turbulence_intensities,
        )
        fmodel.reset_operation() # Remove any previously applied yaw angles
        fmodel.run()
        turbine_powers = fmodel.get_turbine_powers().flatten() / 1e3
        if density == 1.225:
            ax.plot(ws_array, turbine_powers, label="Air Density = %.3f" % density, lw=2, color="k")
        else:
            ax.plot(ws_array, turbine_powers, label="Air Density = %.3f" % density, lw=1)
        ax.grid(True)
        ax.legend()
        ax.set_xlabel("Wind Speed (m/s)")
        ax.set_ylabel("Power (kW)")

        # Power loss to yaw, try a range of yaw angles
        ax = axarr[1]

        fmodel.set(
            wind_speeds=[wind_speed_to_test_yaw],
            wind_directions=[270.0],
            turbulence_intensities=[0.06],
        )
        yaw_result = []
        for yaw in yaw_angles:
            fmodel.set(yaw_angles=np.array([[yaw]]))
            fmodel.run()
            turbine_powers = fmodel.get_turbine_powers().flatten() / 1e3
            yaw_result.append(turbine_powers[0])
        if density == 1.225:
            ax.plot(yaw_angles, yaw_result, label="Air Density = %.3f" % density, lw=2, color="k")
        else:
            ax.plot(yaw_angles, yaw_result, label="Air Density = %.3f" % density, lw=1)
        # ax.plot(yaw_angles,yaw_result,label='Air Density = %.3f' % density)
        ax.grid(True)
        ax.legend()
        ax.set_xlabel("Yaw Error (deg)")
        ax.set_ylabel("Power (kW)")
        ax.set_title("Wind Speed = %.1f" % wind_speed_to_test_yaw)

    # Give a suptitle
    fig.suptitle(t)

plt.show()
import warnings
warnings.filterwarnings('ignore')