Note
Go to the end to download the full example code.
Curtailment — Annual and Monthly#
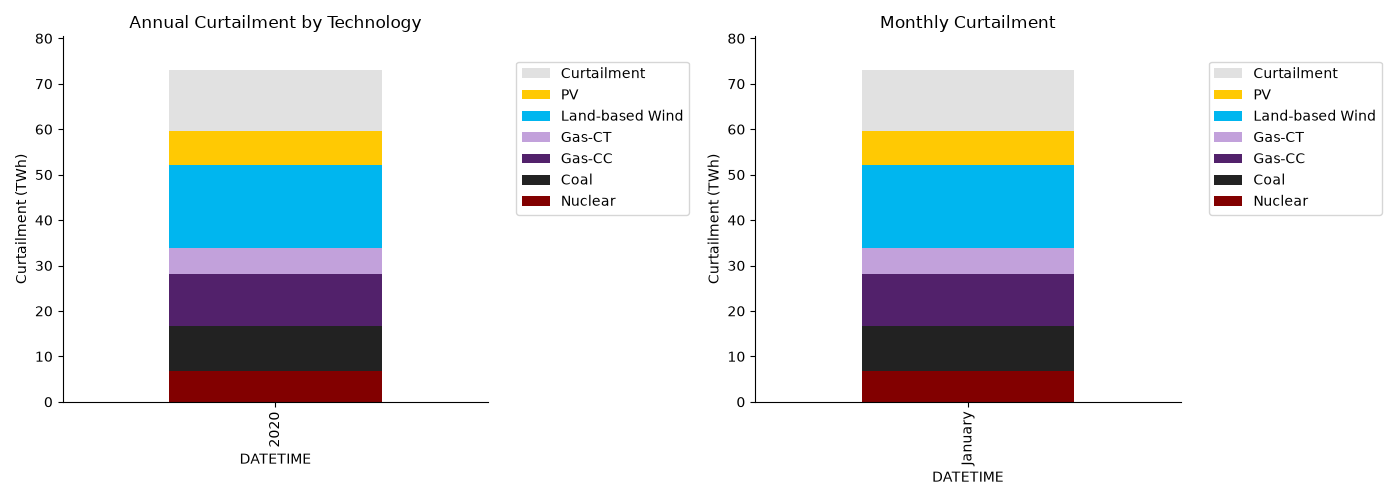
Stacked time series of curtailed VRE energy by technology. The annual view shows total curtailed MWh; the monthly view shows seasonality.
Curtailment is computed as the difference between renewable
availability (the time series parameter) and renewable dispatch
(the variable). It’s only meaningful for technologies in
gc.config.curtailable_tech — typically PV, Wind, RTPV.
/home/runner/work/GridAnalysisToolkit/GridAnalysisToolkit/src/gat/datahelpers/sienna.py:382: UserWarning: StandardLoad was not found. Use one of the following components
  warnings.warn(message, UserWarning)
/home/runner/work/GridAnalysisToolkit/GridAnalysisToolkit/src/gat/scenariohandlers/sienna.py:510: UserWarning: Could not find dataset with pattern ActivePowerTimeSeriesParameter__StandardLoad, consider updating the configuration or removing this pattern to avoid a warning.
  warnings.warn(message, UserWarning)
/home/runner/work/GridAnalysisToolkit/GridAnalysisToolkit/src/gat/scenariohandlers/sienna.py:510: UserWarning: Could not find dataset with pattern ActivePowerInVariable*, consider updating the configuration or removing this pattern to avoid a warning.
  warnings.warn(message, UserWarning)
/home/runner/work/GridAnalysisToolkit/GridAnalysisToolkit/src/gat/scenariohandlers/sienna.py:525: UserWarning: No matching datasets found for ['ActivePowerInVariable*'], consider updating the configuration.
  warnings.warn(message, UserWarning)
/home/runner/work/GridAnalysisToolkit/GridAnalysisToolkit/src/gat/scenariohandlers/sienna.py:708: UserWarning: Unable to create storage load timeseries data, additional calculated loads may not be available.
  warnings.warn(
/home/runner/work/GridAnalysisToolkit/GridAnalysisToolkit/src/gat/scenariohandlers/sienna.py:510: UserWarning: Could not find dataset with pattern ActivePowerOutVariable*, consider updating the configuration or removing this pattern to avoid a warning.
  warnings.warn(message, UserWarning)
/home/runner/work/GridAnalysisToolkit/GridAnalysisToolkit/src/gat/scenariohandlers/sienna.py:510: UserWarning: Could not find dataset with pattern ActivePowerTimeSeriesParameter__StandardLoad, consider updating the configuration or removing this pattern to avoid a warning.
  warnings.warn(message, UserWarning)
import warnings
warnings.filterwarnings("ignore", category=DeprecationWarning)

import matplotlib.pyplot as plt
from gat.scenariohandlers import SiennaScenario
import gat.quickplots as qp

sienna_v4 = "../../example_data/sienna/v4"
scenario = SiennaScenario(
    simulation_files=f"{sienna_v4}/simulation_store.h5",
    system_file=f"{sienna_v4}/sys.json",
)

dispatch = scenario.get_area_dispatch(include_charging=False, include_use=False)

fig, axs = plt.subplots(1, 2, figsize=(14, 5))

qp.plot_annual_system_curtailment_stack(dispatch, ax=axs[0])
axs[0].set_title("Annual Curtailment by Technology")

qp.plot_monthly_system_curtailment_stack(dispatch, ax=axs[1])
axs[1].set_title("Monthly Curtailment")

plt.tight_layout()
plt.show()
Total running time of the script: (0 minutes 0.337 seconds)