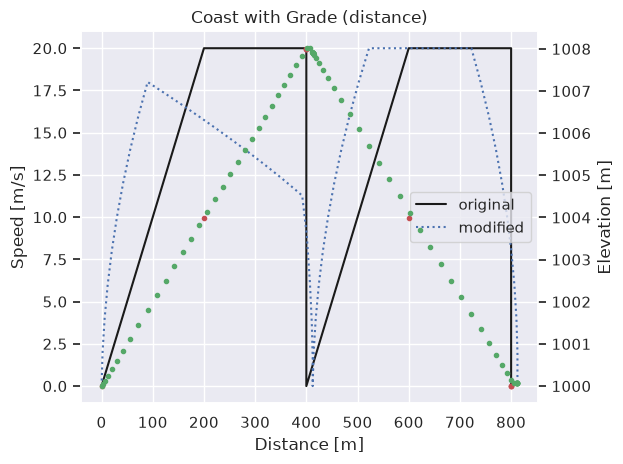
This Connected Automated Vehicle (CAV) demo configures coasting on a custom cycle that includes elevation changes. The plots show both speed and elevation for the original and modified cycles.
import os

import seaborn as sns

import sys
from pathlib import Path

sys.path.insert(0, str(next(p / "demo_scripts" for p in (Path.cwd(), *Path.cwd().parents) if (p / "demo_scripts").is_dir())))

import fastsim as fsim
from plot_utils import plot_speed_by_time, plot_speed_by_dist
sns.set_theme()
SHOW_PLOTS = os.environ.get("SHOW_PLOTS", "true").lower() == "true"
SAVE_FIGS = os.environ.get("SAVE_FIGS", "false").lower() == "true"Build a Custom Cycle with Grade
This cycle has two acceleration/deceleration segments: one uphill (+2% grade) and one downhill (-2% grade).
cyc_d = {
    "time_seconds": [
        0.0, 10.0, 20.0, 30.0, 40.0, 50.0, 60.0, 70.0, 80.0,
    ],
    "speed_meters_per_second": [
        0.0, 20.0, 20.0, 00.0, 00.0, 20.0, 20.0, 00.0, 00.0,
    ],
    "init_elev_meters": 1000.0,
    "grade": [
        0.02, 0.02, 0.02, 0.02, 0.02, -0.02, -0.02, -0.02, -0.02,
    ],
}
cyc0 = fsim.Cycle.from_pydict(cyc_d)
cyc = cyc0.resample(time_step_s=1.0)
Apply Coasting with Grade
When favor_grade_accuracy is true, actual elevations are used for
grade-per-step estimates instead of the step start distance lookup.
veh = fsim.Vehicle.from_resource("2012_Ford_Fusion.yaml")
veh.set_save_interval(1)

man = fsim.Maneuver.create_from(cyc, veh.copy())
d = man.to_pydict()
d["coast_allow"] = True
d["coast_brake_start_speed_meters_per_second"] = 8.9408  # 20 mph
d["coast_brake_accel_meters_per_second_squared"] = -2.5
d["favor_grade_accuracy"] = True
d["coast_allow_passing"] = True
d["coast_max_speed_meters_per_second"] = 33.5280  # 75 mph
d["coast_time_horizon_for_adjustment_seconds"] = 120.0
man = fsim.Maneuver.from_pydict(d)

cyc = man.apply_maneuvers()
sd = fsim.SimDrive(veh, cyc)
sd.walk()Results
Speed and elevation for the original and modified cycles.
if SHOW_PLOTS:
    c0 = cyc0.to_pydict()
    df = sd.to_dataframe()
    plot_speed_by_time(df, c0, title="Coast with Grade", with_elevation=True,
                       save_figs=SAVE_FIGS, show_plots=SHOW_PLOTS)
    plot_speed_by_dist(df, c0, title="Coast with Grade (distance)", with_elevation=True,
                       save_figs=SAVE_FIGS, show_plots=SHOW_PLOTS)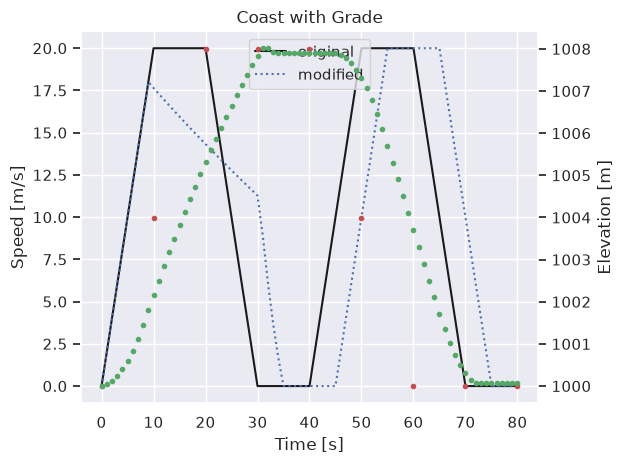
Source: fastsim/docs/demo_scripts/vehicle_controls/demo_coast_with_grade.py