# Gallery
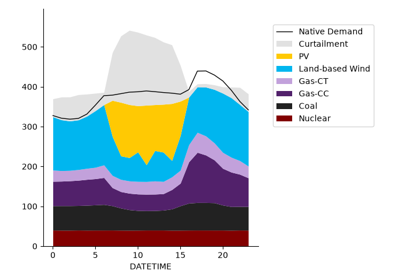
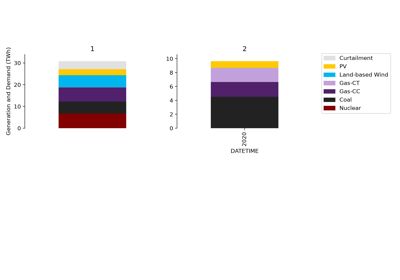
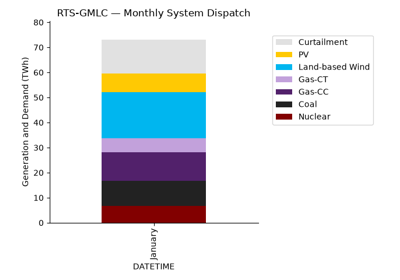
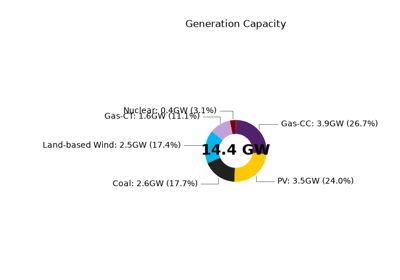
Working examples of GAT’s plotting functions, each driven by an in-repo fixture so you can run them locally without provisioning a project.
## Where the data comes from
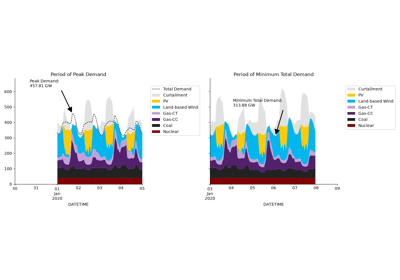
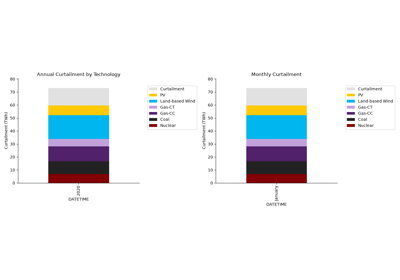
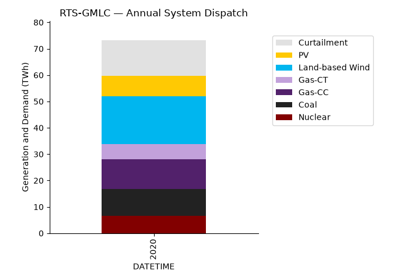
Most examples use the Sienna RTS-GMLC fixture at example_data/sienna/v4/. It’s a one-week unit-commitment run on the modified RTS-GMLC test case, generated by the Dockerized PowerSimulations.jl pipeline at docker/sienna/. To regenerate:
`bash
make sienna-fixture-v4
`
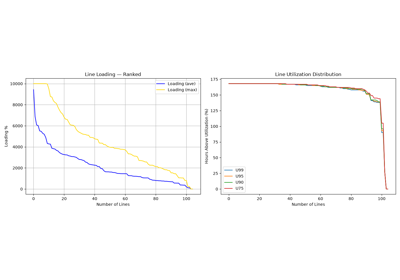
The transmission example (09_transmission_loading.py) uses the Plexos fixture at example_data/plexos/ because the Sienna fixture is built with CopperPlatePowerModel and therefore has no line-flow data.
## Running an example
The examples are plain Python scripts. From docs/gat_examples/:
`bash
python 01_dispatch_annual_system.py
`
Or open in Jupyter and step through the cells. They each instantiate a scenario directly and pass it to a gat.quickplots function.
## Note on construction
The examples instantiate SiennaScenario / PlexosScenario directly because they’re path-based demos. Production code should use gat.load(…) to obtain a scenario object via the supported v1 entry point — see [Python API: Loading Projects and Scenarios](../python_api_load.md).
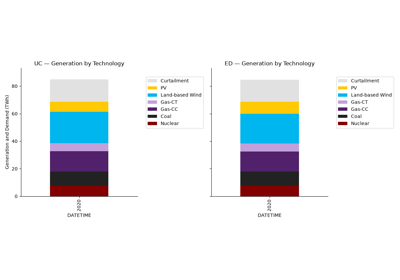
Model vs Model: UC, ED, and Emulator from One Store