Layer Combination and Favorability Modeling geoPFA: 2D Example from Newberry Volcano, OR
This notebook continues the geoPFA tutorial series using the
processed data prepared in the previous notebook.
Here, we load the preprocessed configuration and datasets, then use the Voter–Veto method to combine layers into geothermal favorability models.
1. Imports and Setup
# --- General imports ---
from pathlib import Path
import geopandas as gpd

# --- geoPFA core classes ---
from geopfa.io.data_readers import GeospatialDataReaders
from geopfa.processing import Cleaners
from geopfa.plotters import GeospatialDataPlotters
from geopfa.io.data_writers import GeospatialDataWriters
from geopfa.layer_combination import VoterVeto

# --- Utilities ---
from geopfa.io.data_readers import safe_json_load
Define Directories and CRS
# Target CRS (UTM Zone 10N for Newberry, Oregon)
target_crs = 26910

# Define key directories relative to this notebook
notebook_dir = Path(__file__).resolve().parent if "__file__" in locals() else Path.cwd()
project_dir = notebook_dir.parent

data_dir = project_dir / "data"
config_dir = project_dir / "config"

print("Notebook directory:", notebook_dir)
print("Data directory:", data_dir)
print("Config directory:", config_dir)
Notebook directory: c:UserssmellocodegeoPFAexamplesNewberry2Dnotebooks
Data directory: c:UserssmellocodegeoPFAexamplesNewberry2Ddata
Config directory: c:UserssmellocodegeoPFAexamplesNewberry2Dconfig
Load the Processed PFA Configuration
pfa_path = config_dir / "newberry_superhot_processed_config.json"
pfa = safe_json_load(pfa_path)
Successfully loaded JSON file from: c:UserssmellocodegeoPFAexamplesNewberry2Dconfignewberry_superhot_processed_config.json
Load Contextual Data for Plotting
Here we import a well path with associated temperature data for context
in plots. geoPFA also allows the input of an area outline.
outline_path = data_dir / "supporting_data" / "national_monument_boundary" / "NNVM_bounds.shp"
outline = gpd.read_file(outline_path).to_crs(target_crs)

print(f"Loaded project outline: {outline_path.name}")
Loaded project outline: NNVM_bounds.shp
2. Reading Processed Data and Setting Extent
model output created by functions
such as interpolate_points.This step ensures that every layer is loaded with consistent metadata (CRS, extent, units) before being combined.
Gather Processed Data
pfa = GeospatialDataReaders.gather_processed_data(data_dir,pfa,crs=target_crs)
criteria: geologic
     component: heat
             reading layer: density_joint_inv
             reading layer: mt_resistivity_joint_inv
             reading layer: temperature_model_500m
             reading layer: earthquakes
     component: reservoir
             reading layer: density_joint_inv
             reading layer: mt_resistivity_joint_inv
             reading layer: earthquakes
             reading layer: lineaments
     component: insulation
             reading layer: density_joint_inv
             reading layer: mt_resistivity_joint_inv
             reading layer: earthquakes
             reading layer: temperature_model_500m
Each layer is placed back under
pfa["criteria"][criteria]["components"][component]["layers"][layer]["model"],
exactly where the processing functions would have written it in the
previous step.
Set Extent
To ensure proper alignment, we’ll re-establish the same 2D extent used during processing. This guarantees that layer combination occurs on a consistent grid.
extent_layer = (
    pfa["criteria"]["geologic"]["components"]["heat"]["layers"]["mt_resistivity_joint_inv"]["model"]
)
extent = Cleaners.get_extent(extent_layer)

print(f"Extent: {extent}")
Extent: [624790.891073, 4825350.71118, 653145.891073, 4855310.71118]
The extent should match exactly what was defined in the previous notebook. If layers were processed elsewhere or on a different grid, they must be re-projected or re-interpolated before combination.
3. Transformation and Layer Combination
With all data aligned, we can now combine layers into component and criteria favorability models using a modified version of the Voter–Veto method published in Ito et al., 2017.
The method: - Normalizes each layer and transforms into marginal favorability layers for each component - Weights and combines marginal favorability layers to form component favorabiltiy (e.g., heat, reservoir, insulation) - Weights and combines components into a higher-level criteria models (e.g., geologic favorability) - Optionally normalizes outputs to a defined scale (e.g., 0–5) - Weights and combines criteria favorability models into an overall combined favorability model (not included in this example)
The figure below provides context for where we are in the full
geoPFA framework: 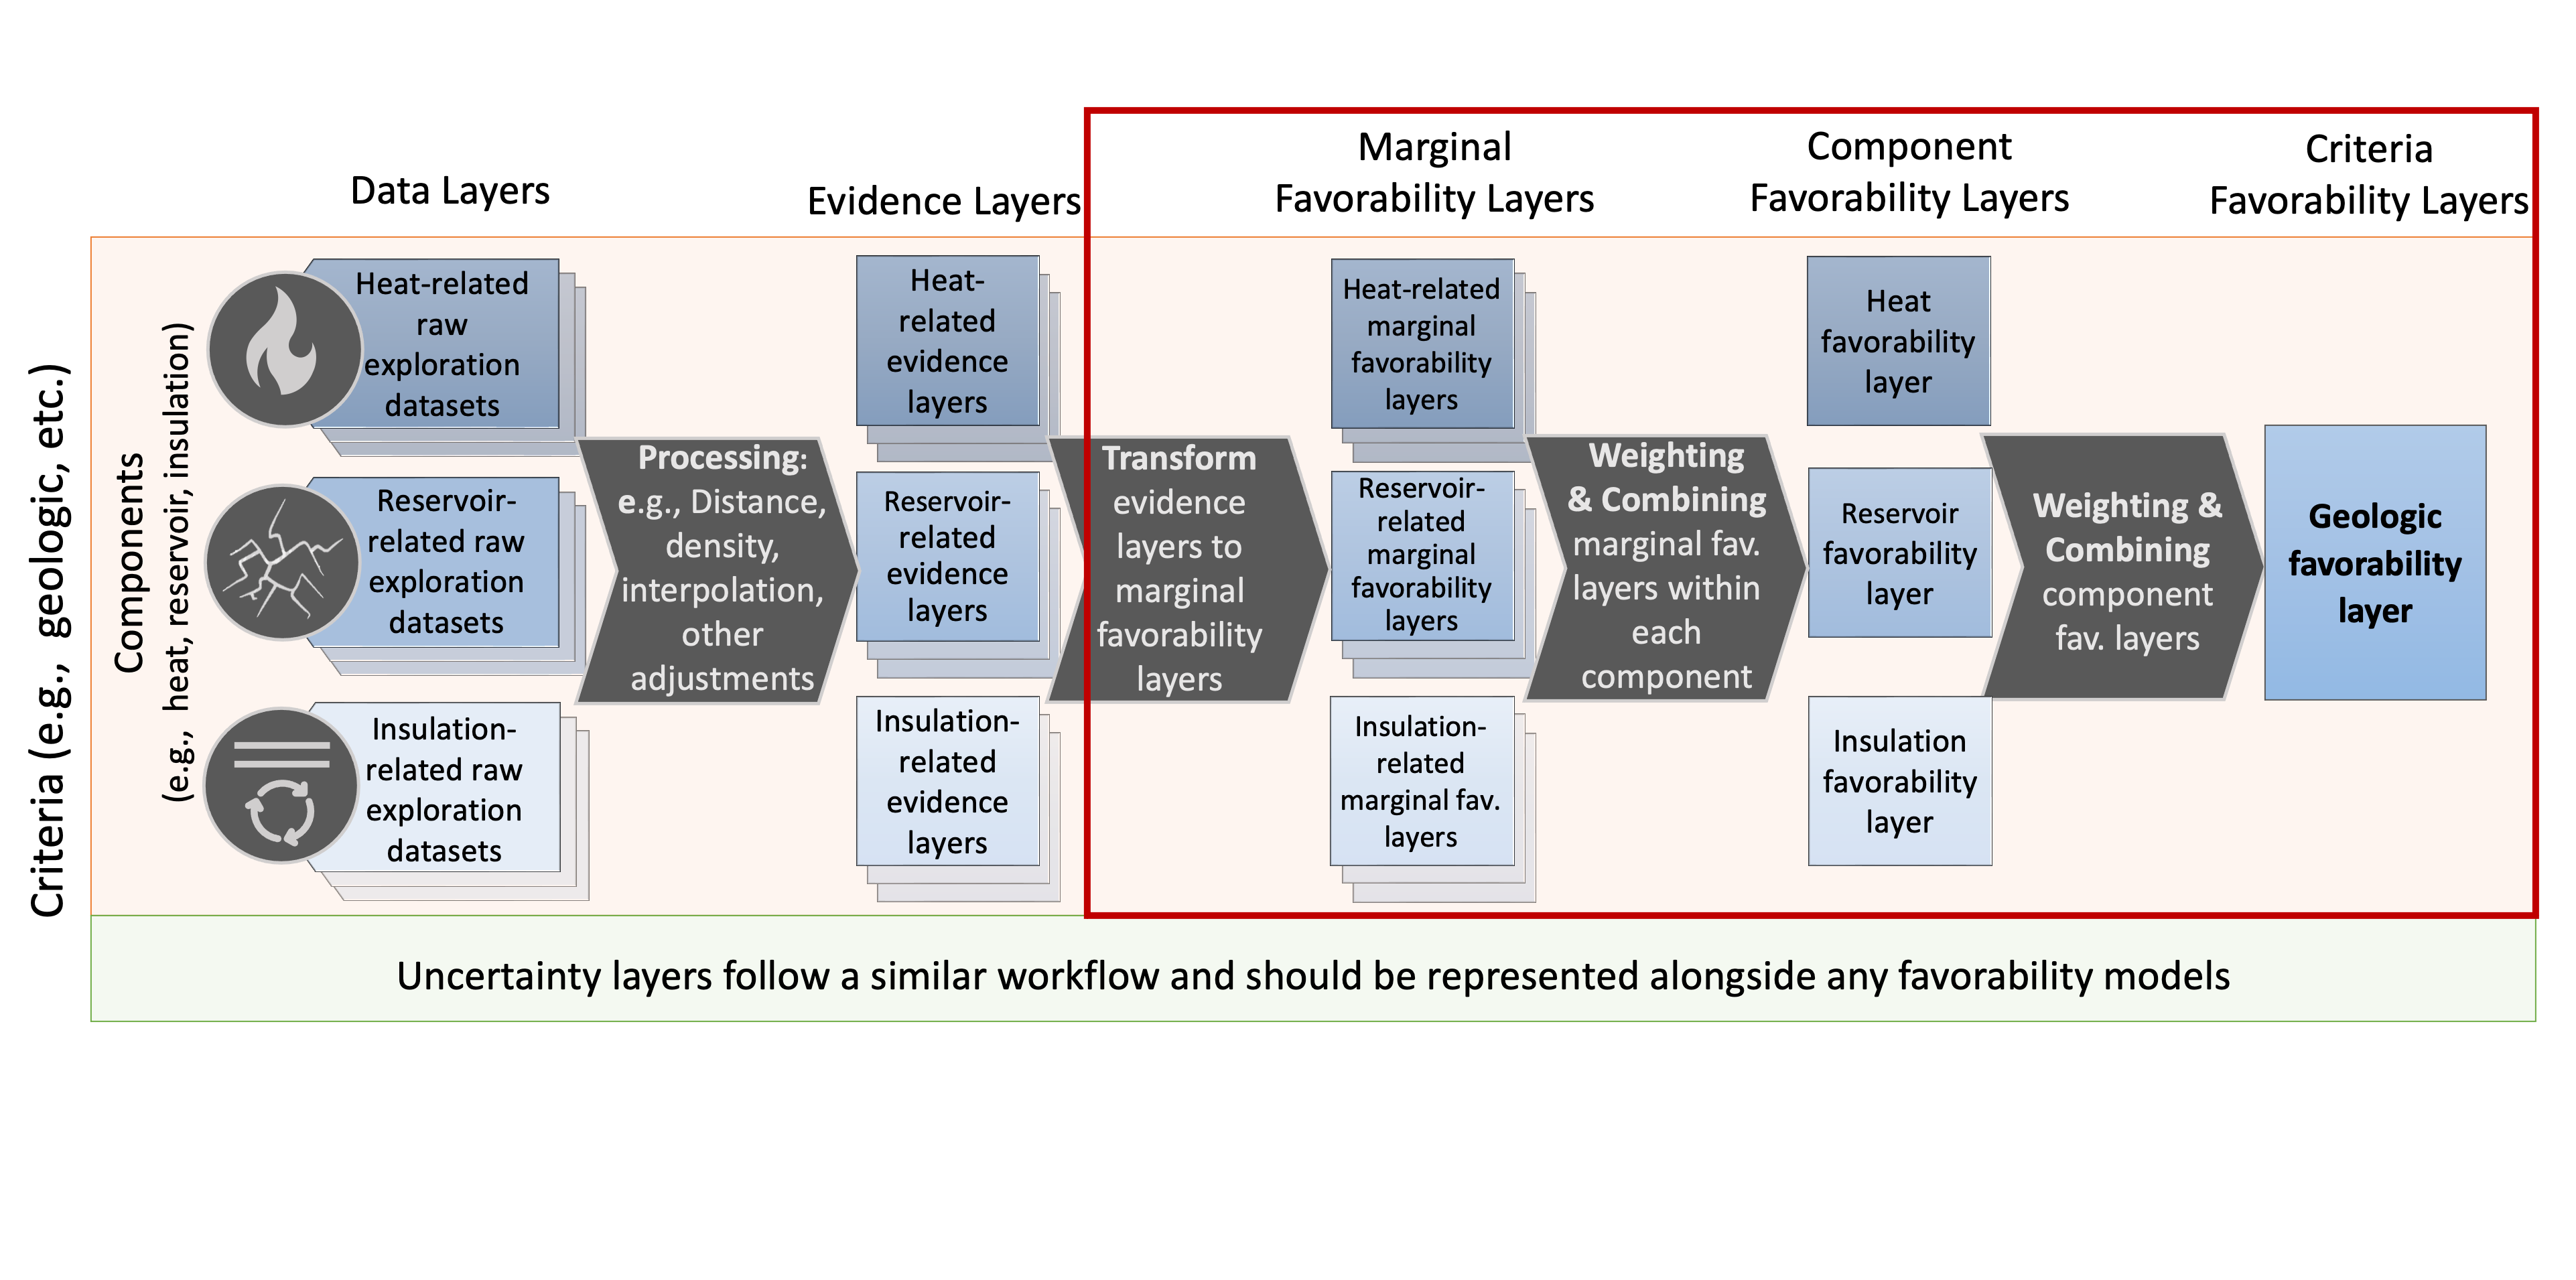
pfa = VoterVeto.do_voter_veto(
    pfa,
    normalize_method="minmax",  # normalize each layer between its min & max
    component_veto=False,       # no veto at the component level
    criteria_veto=True,         # apply veto across components if needed
    normalize=True,             # normalize final favorability model
    norm_to=5,                  # scale favorability to 0-5
)

print("Layer combination complete using the Voter-Veto method.")
Combining 2D PFA layers with the voter-veto method.
criterion: geologic
    component: heat
        layer: density_joint_inv
        - Transformed with method: negate
        - Normalized with method: minmax
        layer: mt_resistivity_joint_inv
        - Transformed with method: negate
        - Normalized with method: minmax
        layer: temperature_model_500m
        - Transformed with method: None
        - Normalized with method: minmax
        layer: earthquakes
        - Transformed with method: negate
        - Normalized with method: minmax
    component: reservoir
        layer: density_joint_inv
        - Transformed with method: negate
        - Normalized with method: minmax
        layer: mt_resistivity_joint_inv
        - Transformed with method: negate
        - Normalized with method: minmax
        layer: earthquakes
        - Transformed with method: none
        - Normalized with method: minmax
        layer: lineaments
        - Transformed with method: none
        - Normalized with method: minmax
    component: insulation
        layer: density_joint_inv
        - Transformed with method: negate
        - Normalized with method: minmax
        layer: mt_resistivity_joint_inv
        - Transformed with method: negate
        - Normalized with method: minmax
        layer: earthquakes
        - Transformed with method: negate
        - Normalized with method: minmax
        layer: temperature_model_500m
        - Transformed with method: None
        - Normalized with method: minmax
Layer combination complete using the Voter-Veto method.
4. Visualizing Favorability Results
With the Voter–Veto layer combination complete, we can now visualize the resulting favorability models.
pfa["criteria"][criteria]["components"][component]["pr_norm"] -
normalized component favorabilitypfa["criteria"][criteria]["pr_norm"] - normalized
criteria-level (overall) favorabilityWe’ll plot both the total (geologic) favorability model and the individual component models to interpret how heat, reservoir, and insulation contribute to the overall result.
Combined Geologic Favorability
# Combined (criteria-level) favorability model
gdf = pfa["criteria"]["geologic"]["pr_norm"].copy()

col = "favorability"
units = "favorability"
title = "Combined geologic favorability model"

GeospatialDataPlotters.geo_plot(
    gdf,
    col,
    units,
    title,
    area_outline=outline,
    extent=extent,
    figsize=(5, 5),
    markersize=0.75
)
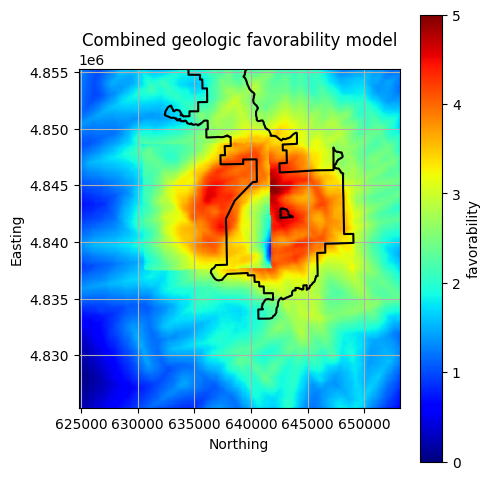
Component Favorability Maps
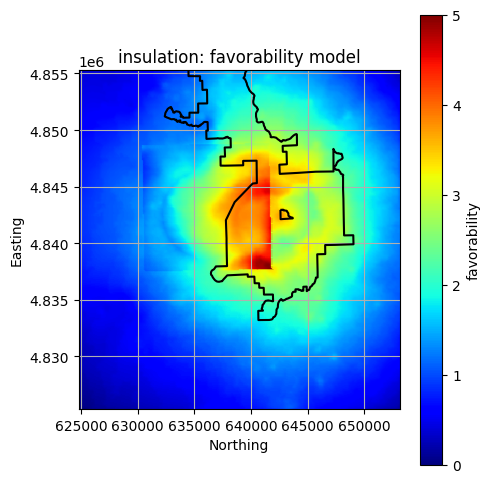
Plot individual component favorability layers to compare how each contributes to the total.
for criteria, crit_data in pfa["criteria"].items():
    print(criteria)
    for component, comp_data in crit_data["components"].items():
        print(f"\t{component}")

        gdf = comp_data["pr_norm"].copy()
        col = "favorability"
        units = "favorability"
        title = f"{component}: favorability model"

        GeospatialDataPlotters.geo_plot(
            gdf,
            col,
            units,
            title,
            area_outline=outline,
            extent=extent,
            figsize=(5, 5),
            markersize=0.75,
        )
geologic
    heat
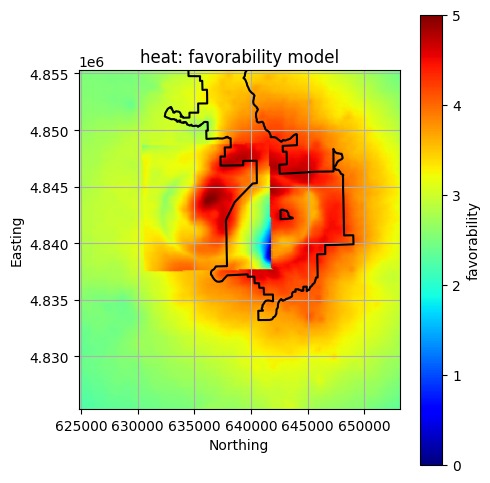
reservoir
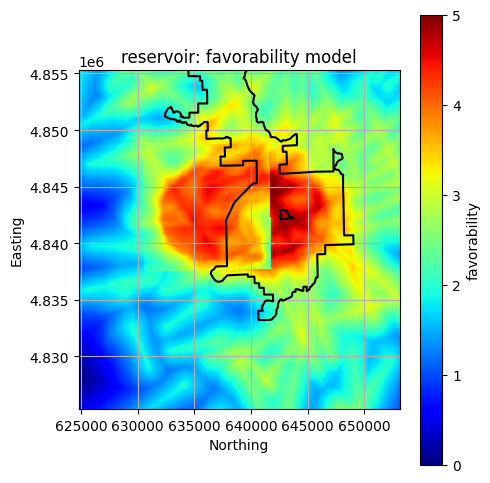
insulation
5. Exporting Favorability Maps
Each GeoDataFrame is written to a shapefile using
GeospatialDataWriters.export_favorability_maps. We set the
level = all parameter to ensure all maps/models at every level are
exported (combined favorability model, all criteria and component
favorability models). However, the
GeospatialDataWriters.export_favorability_maps allows the choice of
only specified models being exported.
output_dir = data_dir / "outputs"

GeospatialDataWriters.export_favorability_models(
    pfa,
    output_dir,  # a new directory will be created if it doesn't already exist
    target_crs=target_crs,
    fmt="shp",
    level="all"
)
Exporting favorability models...
C:UserssmellocodegeoPFAgeopfaiodata_writers.py:66: UserWarning:Column names longer than 10 characters will be truncated when saved to ESRI Shapefile.
c:UserssmellocodegeoPFA.pixienvsdefaultLibsite-packagespyogrioraw.py:723: RuntimeWarning:Normalized/laundered field name: 'favorability' to 'favorabili'
Combined model written to: c:UserssmellocodegeoPFAexamplesNewberry2Ddataoutputscombined_favorability_model
C:UserssmellocodegeoPFAgeopfaiodata_writers.py:66: UserWarning:Column names longer than 10 characters will be truncated when saved to ESRI Shapefile.
c:UserssmellocodegeoPFA.pixienvsdefaultLibsite-packagespyogrioraw.py:723: RuntimeWarning:Normalized/laundered field name: 'favorability' to 'favorabili'
Wrote geologic criteria model
C:UserssmellocodegeoPFAgeopfaiodata_writers.py:66: UserWarning:Column names longer than 10 characters will be truncated when saved to ESRI Shapefile.
c:UserssmellocodegeoPFA.pixienvsdefaultLibsite-packagespyogrioraw.py:723: RuntimeWarning:Normalized/laundered field name: 'favorability' to 'favorabili'
Wrote heat component model
C:UserssmellocodegeoPFAgeopfaiodata_writers.py:66: UserWarning:Column names longer than 10 characters will be truncated when saved to ESRI Shapefile.
c:UserssmellocodegeoPFA.pixienvsdefaultLibsite-packagespyogrioraw.py:723: RuntimeWarning:Normalized/laundered field name: 'favorability' to 'favorabili'
Wrote reservoir component model
C:UserssmellocodegeoPFAgeopfaiodata_writers.py:66: UserWarning:Column names longer than 10 characters will be truncated when saved to ESRI Shapefile.
c:UserssmellocodegeoPFA.pixienvsdefaultLibsite-packagespyogrioraw.py:723: RuntimeWarning:Normalized/laundered field name: 'favorability' to 'favorabili'
            Wrote insulation component model

Finished exporting favorability models.
Summary
You now have: - A combined geologic criteria favorability map - Individual component favorability models
geoPFA for the Newberry Volcano play fairway analysis.