This demo shows how SimParams can be configured to handle trace miss
events, where the vehicle cannot achieve the target speed.
import os

import matplotlib.pyplot as plt
import numpy as np
import seaborn as sns

import fastsim as fsim
sns.set_theme()
SHOW_PLOTS = os.environ.get("SHOW_PLOTS", "true").lower() == "true"
SAVE_FIGS = os.environ.get("SAVE_FIGS", "false").lower() == "true"Build a Custom Cycle
This cycle has a sharp acceleration from 0 to 8 m/s in one second, which the vehicle cannot fully achieve (a trace miss).
cyc_d = {
    "time_seconds": [0.0, 1.0, 2.0, 3.0, 4.0, 5.0, 6.0, 7.0, 8.0],
    "speed_meters_per_second": [0.0, 0.0, 8.0, 8.0, 8.0, 8.0, 8.0, 0.0, 0.0],
}
cyc = fsim.Cycle.from_pydict(cyc_d)
cyc0 = cyc.copy()
veh = fsim.Vehicle.from_resource("2012_Ford_Fusion.yaml")
veh.set_save_interval(1)Configure Trace Miss Options
TraceMissOptions controls what happens when the vehicle cannot match
the target speed:
"Allow": allow trace miss without any correction"AllowChecked": allow trace miss within error tolerance"Error"(default): throw error when trace miss happens"Correct": correct trace miss with driver model that catches up
trace_miss_correct_max_steps is the maximum number of steps in which to
re-rendezvous with the reference trace. The trajectory with the smallest
peak acceleration is chosen. Must be 2 or greater; defaults to 6.
params = fsim.SimParams.default().to_pydict()
params["trace_miss_opts"] = "Correct"
params["trace_miss_correct_max_steps"] = 6

sd = fsim.SimDrive(veh, cyc, fsim.SimParams.from_pydict(params))
sd.walk()
Results
Original cycle speed vs. achieved speed with trace miss correction.
if SHOW_PLOTS:
    c0 = cyc0.to_pydict()
    df = sd.to_dataframe()

    fig, ax = plt.subplots(figsize=(10, 4))
    ax.plot(
        np.array(c0["time_seconds"]),
        np.array(c0["speed_meters_per_second"]),
        label="Original",
    )
    ax.plot(
        np.array(df["cyc.time_seconds"]),
        np.array(df["veh.history.speed_ach_meters_per_second"]),
        linestyle="--",
        label="Achieved",
    )
    ax.set_xlabel("Time [s]")
    ax.set_ylabel("Speed [m/s]")
    ax.set_title("Trace Miss Correction: Speed vs. Time")
    ax.legend()
    plt.tight_layout()
    plt.show()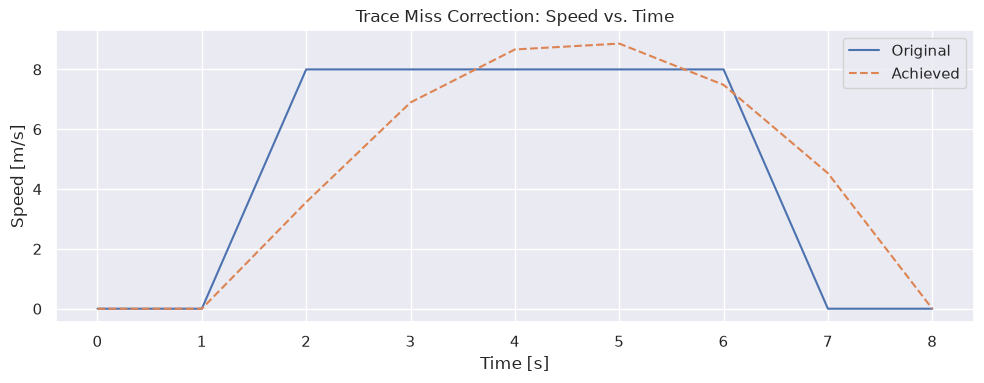
if SHOW_PLOTS:
    fig, ax = plt.subplots(figsize=(10, 4))
    ax.plot(
        np.array(c0["dist_meters"]),
        np.array(c0["speed_meters_per_second"]),
        label="Original",
    )
    ax.plot(
        np.array(df["cyc.dist_meters"]),
        np.array(df["veh.history.speed_ach_meters_per_second"]),
        linestyle="--",
        label="Achieved",
    )
    ax.set_xlabel("Distance [m]")
    ax.set_ylabel("Speed [m/s]")
    ax.set_title("Trace Miss Correction: Speed vs. Distance")
    ax.legend()
    plt.tight_layout()
    plt.show()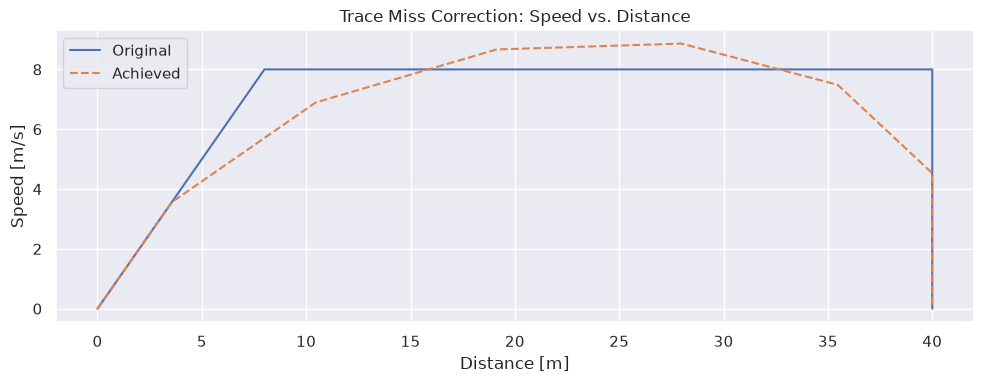
if SHOW_PLOTS:
    fig, ax = plt.subplots(figsize=(10, 4))
    ax.plot(
        np.array(c0["time_seconds"]),
        np.array(c0["dist_meters"]),
        label="Original",
    )
    ax.plot(
        np.array(df["cyc.time_seconds"]),
        np.array(df["cyc.dist_meters"]),
        linestyle="--",
        label="Achieved",
    )
    ax.set_xlabel("Time [s]")
    ax.set_ylabel("Distance [m]")
    ax.set_title("Trace Miss Correction: Distance vs. Time")
    ax.legend()
    plt.tight_layout()
    plt.show()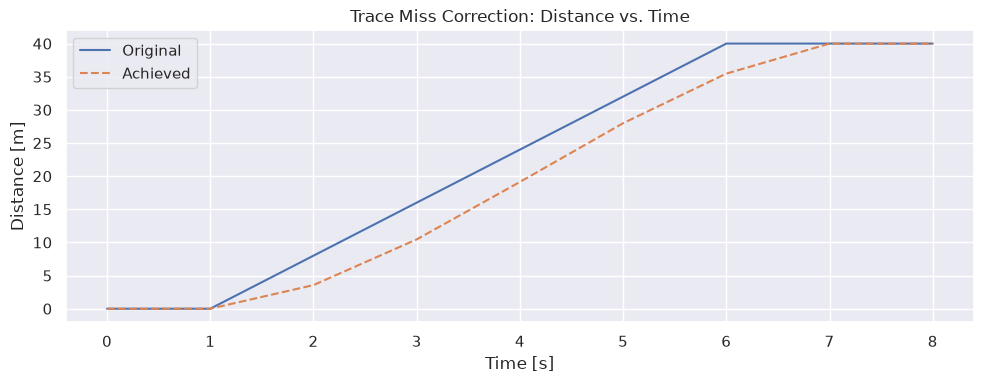
Source: fastsim/docs/demo_scripts/vehicle_controls/demo_trace_miss.py