Monitoring and remote control
When a controller runs the experiments, the web app can show a monitor view: the work queue, the model's health and the objective as results arrive, with a button to ask the controller to pause. This page opens that view, explains what it shows, and lists the calls and events behind it.
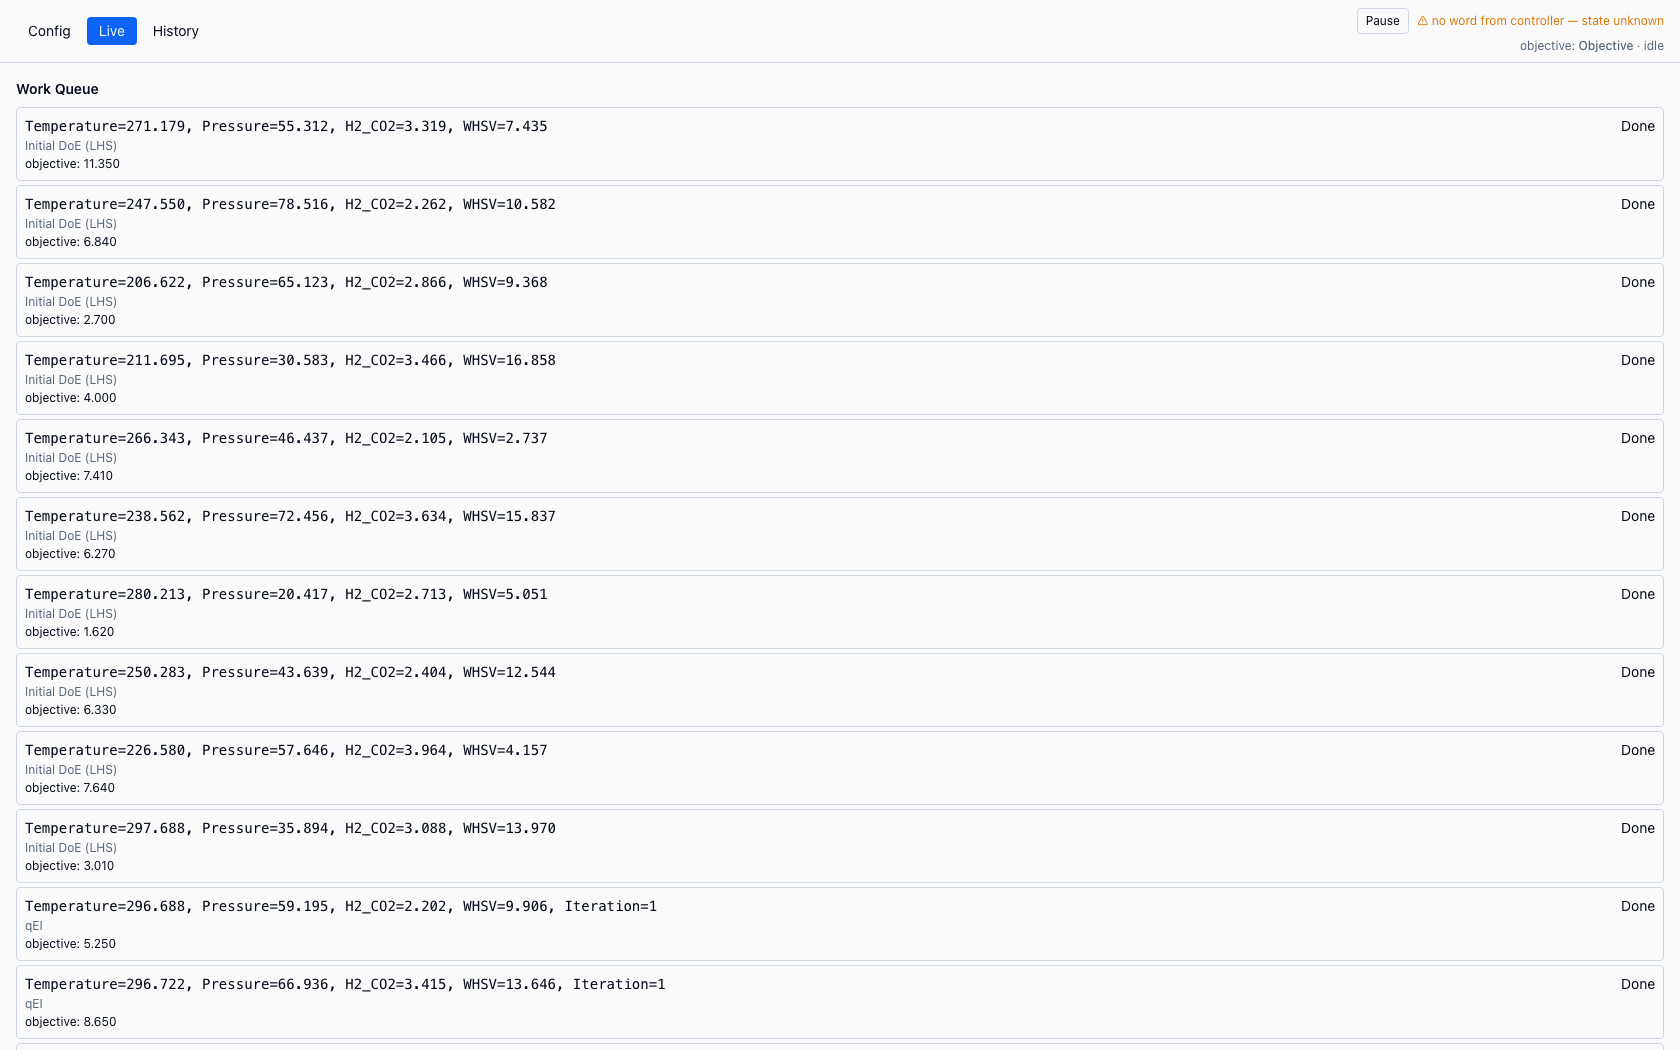
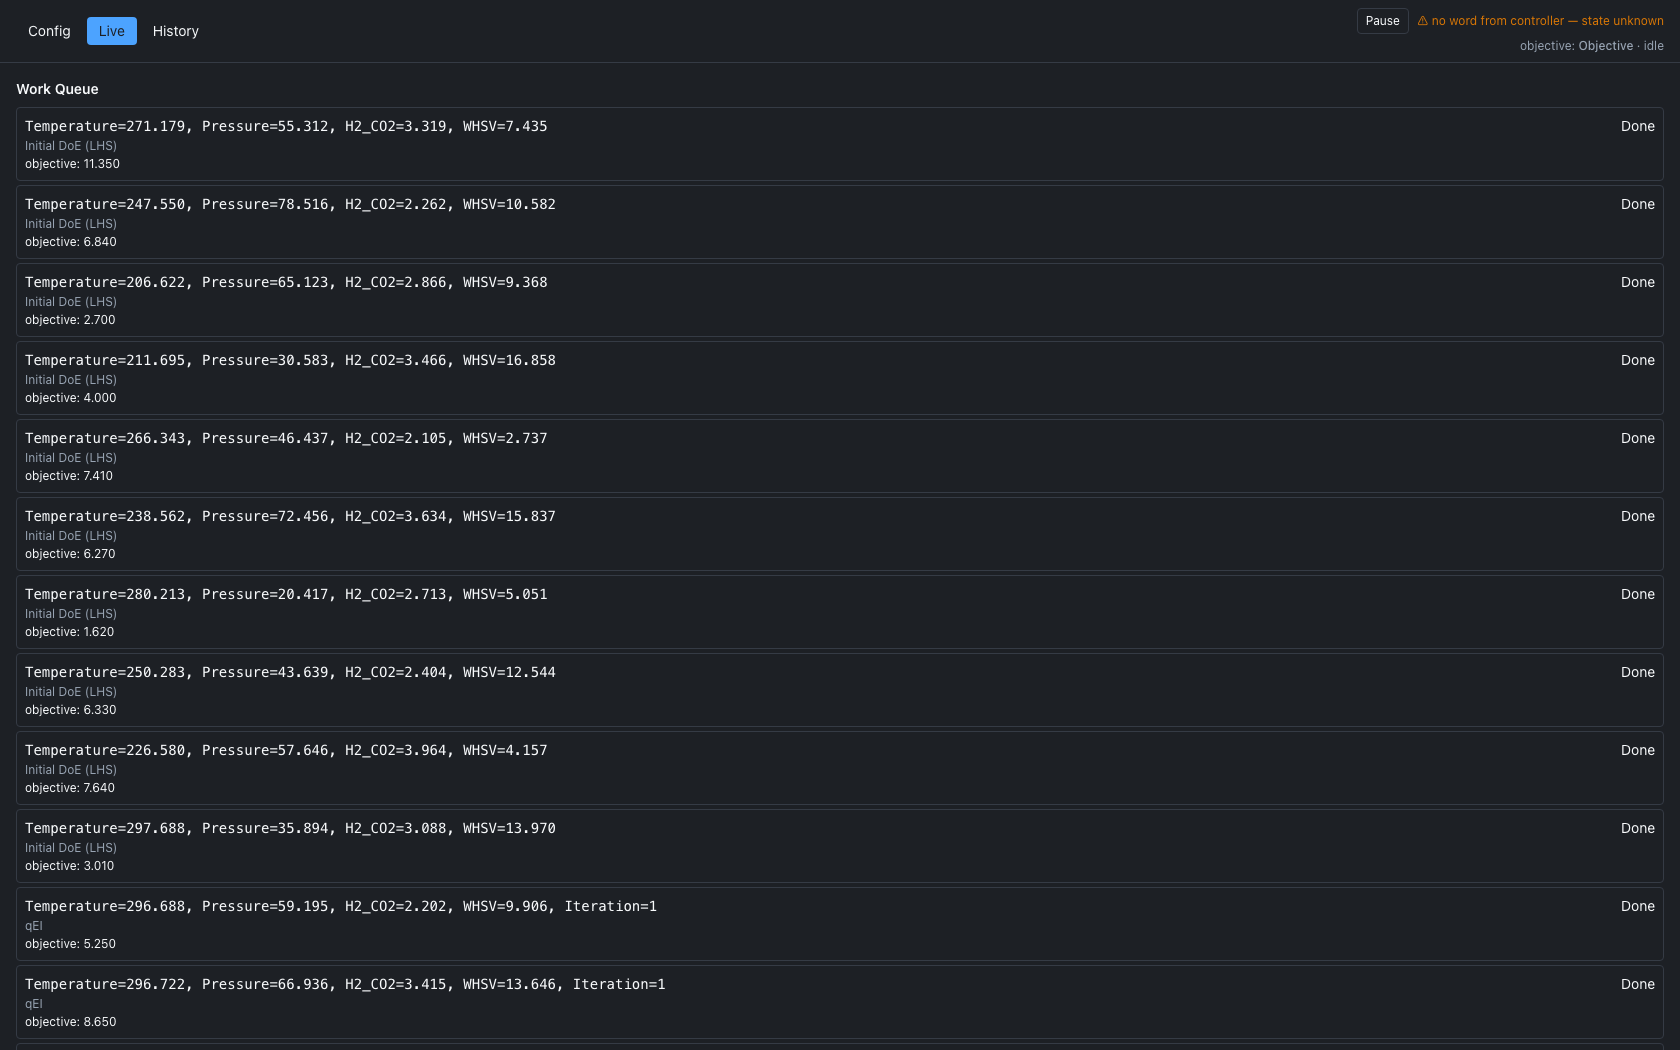
The monitor view with no controller attached, so the strip reports that it has heard nothing. Each row of the Work Queue is a staged point with its inputs, the reason it was run and, once Done, its objective.
1. Open the monitor
The monitor needs a session ID. Add mode=monitor to the address:
The optional tab=config or tab=history opens that tab first. The app also switches to the monitor by itself when a controller locks the session, and a message names the controller that connected; when the lock is released it returns to the normal interface, unless the address has mode=monitor.
The lock does not protect the session: the API still accepts requests from other clients while it is locked.
2. Read the monitor
| Tab | What it shows |
|---|---|
| Live | The Work Queue, with one row per staged point: its inputs, the reason it was staged, its status (Pending, Running, Done or Failed), the objective value once Done and the error text if Failed. Below it, the model's cross-validation metrics plot and parity plot, and Objective so far: each result and the best result so far, in the direction of the last suggestion's goal (the maximum before any suggestion). |
| Config | The variables, model, acquisition and initial design panels, as in the normal interface. While an item is running, a banner says that changes apply to the next suggestion the controller asks for, because ALchemist does not start experiment cycles itself. |
| History | The changes made to the model and acquisition settings, each with its iteration and time, then the calibration curve, the Q-Q plot and the model's hyperparameters. |
At the top right, below the Pause button, a line beginning "objective:" names the objective, using the label the controller stored for it (the default is "Objective"), and says "running" while a queue item is running and "idle" otherwise. The views update as events arrive, without a refresh.
3. Ask the controller to pause
- Choose Pause. A message reads "Pause requested", and the strip waits for the controller to answer.
- When the controller reports that it has paused, the strip reads "controller: paused" and the button changes to Resume.
- Choose Resume to ask it to carry on.
ALchemist does not stop anything itself. It stores your request on the session, and the controller, which alone is allowed to touch the equipment, reads it, decides, and reports what it is now doing. The state the monitor shows is the one the controller reported, never the one you asked for.
| The strip reads | It means |
|---|---|
| "controller: running", then "heard 3s ago" and any detail the controller sent | The controller reported this state 3 seconds ago. |
| "controller: running" with "pause requested 12s ago" and "not yet acknowledged" in amber | You asked for a pause and the controller has not yet reported one. It is still running, as far as anyone knows. |
| "no word from controller for 42s" and "state unknown" in amber | The controller has not reported for more than 30 seconds (three of its 10-second heartbeats), or never has. No state is shown, rather than the last one. |
Pause and Resume are the only controls; there is no stop button.
These calls are what the strip does, on a local session. A controller that talks to a server uses the REST tab.
from alchemist_core import OptimizationSession

session = OptimizationSession()
session.set_control_request("pause", requested_by="analyst-laptop")
session.set_control_report("paused", reported_by="reactor-controller", detail="holding for GC")
print(session.get_control())
The record has seven fields: requested, requested_at, requested_by, reported, reported_at, reported_by and detail. requested is run or pause; reported is idle, running, paused or failed. A change of either value adds an entry to the audit log; a repeated report, which is a heartbeat, does not.
A person's request writes requested; the controller writes reported. One request carries one half, and a body with both is refused.
PUT /api/v1/sessions/{session_id}/control
Content-Type: application/json

{"requested": "pause", "requested_by": "analyst-laptop"}
PUT /api/v1/sessions/{session_id}/control
Content-Type: application/json

{"reported": "paused", "reported_by": "reactor-controller", "detail": "holding for GC"}
A controller should repeat its report about every 10 seconds, even when nothing has changed, so the monitor can tell a quiet controller from a paused one. GET /api/v1/sessions/{session_id}/control returns the record.
A controller switches the app to the monitor view by locking the session:
POST /api/v1/sessions/{session_id}/lock
Content-Type: application/json

{"locked_by": "Reactor Controller v1.2"}
The response includes a lock_token. DELETE /api/v1/sessions/{session_id}/lock?lock_token=<token> releases the lock, and without a token it releases it by force. The loop that a controller runs is described in The autonomous loop, and its queue in Staging and the work queue.
4. Events behind the monitor
The app listens on a WebSocket at /api/v1/ws/sessions/{session_id}, and a controller or a dashboard can too. The app sends nothing on it, and reconnects 5 seconds after a drop. Each message is JSON with an event key.
event |
Sent when | Other keys |
|---|---|---|
connected |
The socket opens. | session_id, message |
lock_status_changed |
A client locks or unlocks the session. | locked, locked_by, locked_at |
experiments_updated |
Results are added or loaded. | n_experiments |
model_trained |
A model is retrained as results are recorded. Train Model does not send it. | metrics |
queue_updated |
Items are staged or removed. | none |
queue_item_updated |
One item changes state. | item_id, status, reason, output, error |
control_changed |
Either half of the control record is written, heartbeats included. | control |
5. Notifications
The app reports what happens in messages at the bottom right of the window, each with a close button. Success and information messages go away after a few seconds. Errors and warnings stay for 10 seconds, long enough to read a long one. The events above produce some of them, in the monitor and in the normal interface: "Experiment data updated (16 total)", "Model retrained with new data", and the controller connecting and disconnecting.
How ALchemist does it
The control record lives on the session in alchemist_core/session.py and is saved with it. The two halves have separate writers so that a screen cannot show an acknowledgment the controller never sent. The strip's age comes from a one-second timer in the browser, so the age keeps counting through a silence instead of freezing on "running". The web side is in alchemist-web/src/features/monitoring.