Graphs#
The Graphs tab on the Results page allows you to create your own graphs of results data after running a simulation.
To show and hide graphs:
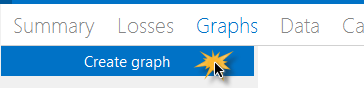
Click the Graphs tab at the top of the Results page.
Click Create Graph.
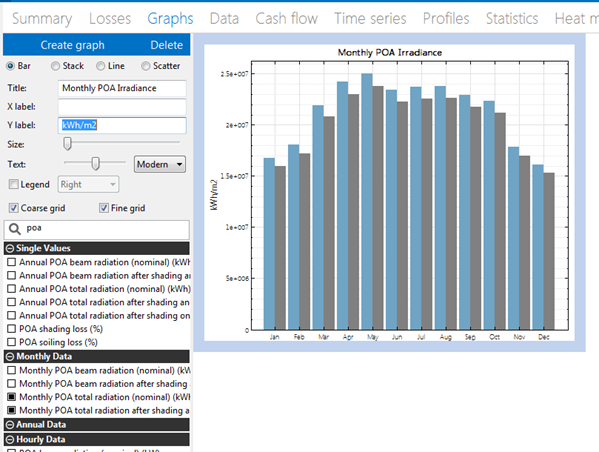
Choose a graph type, and type labels for the title and x- and y-axes.
In the list of variables, choose variables to include in the graph. Type a few letters of a variable name to filter the list.
You can adjust the width of graph lines, text style, legend position, and grid line style.
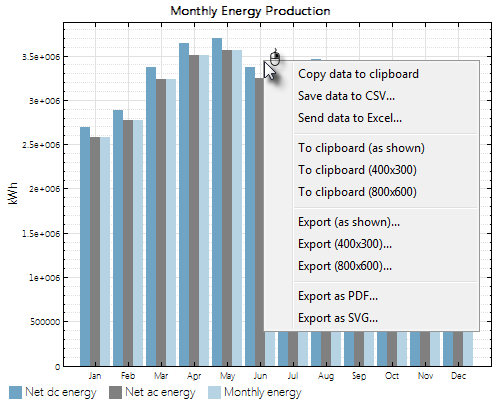
To export the graph image or data:
To export data from a graph, right-click the graph and choose an export option: